GridView EB Monitoring
System Documentation
A live, intelligent electricity cost audit platform — continuously analysing 3,726 TNEB service connections across TCMC to surface every rupee of avoidable expenditure.
How the Audit Works
Every insight on this platform is derived from official TNEB bill data. The system runs an automated pipeline every day at 02:01 AM, pulling, parsing, and analysing bills for all 3,726 connections under TCMC.
Fetch
Raw bill data pulled from the TNEB portal for all 3,726 service connections — automatically, without any manual download.
Parse & Consolidate
Bills are parsed, deduplicated, and merged into a structured database. Each cycle processes 2,82,141 historical bill records.
Analyse
AI algorithms scan for anomalies — demand spikes, penalty patterns, zero usage, load mismatches — across all connections simultaneously.
Surface Insights
All dashboards update in real time. Every finding — from a single overloaded connection to ₹51 L in load savings — is ready by morning.
Revenue Command Center
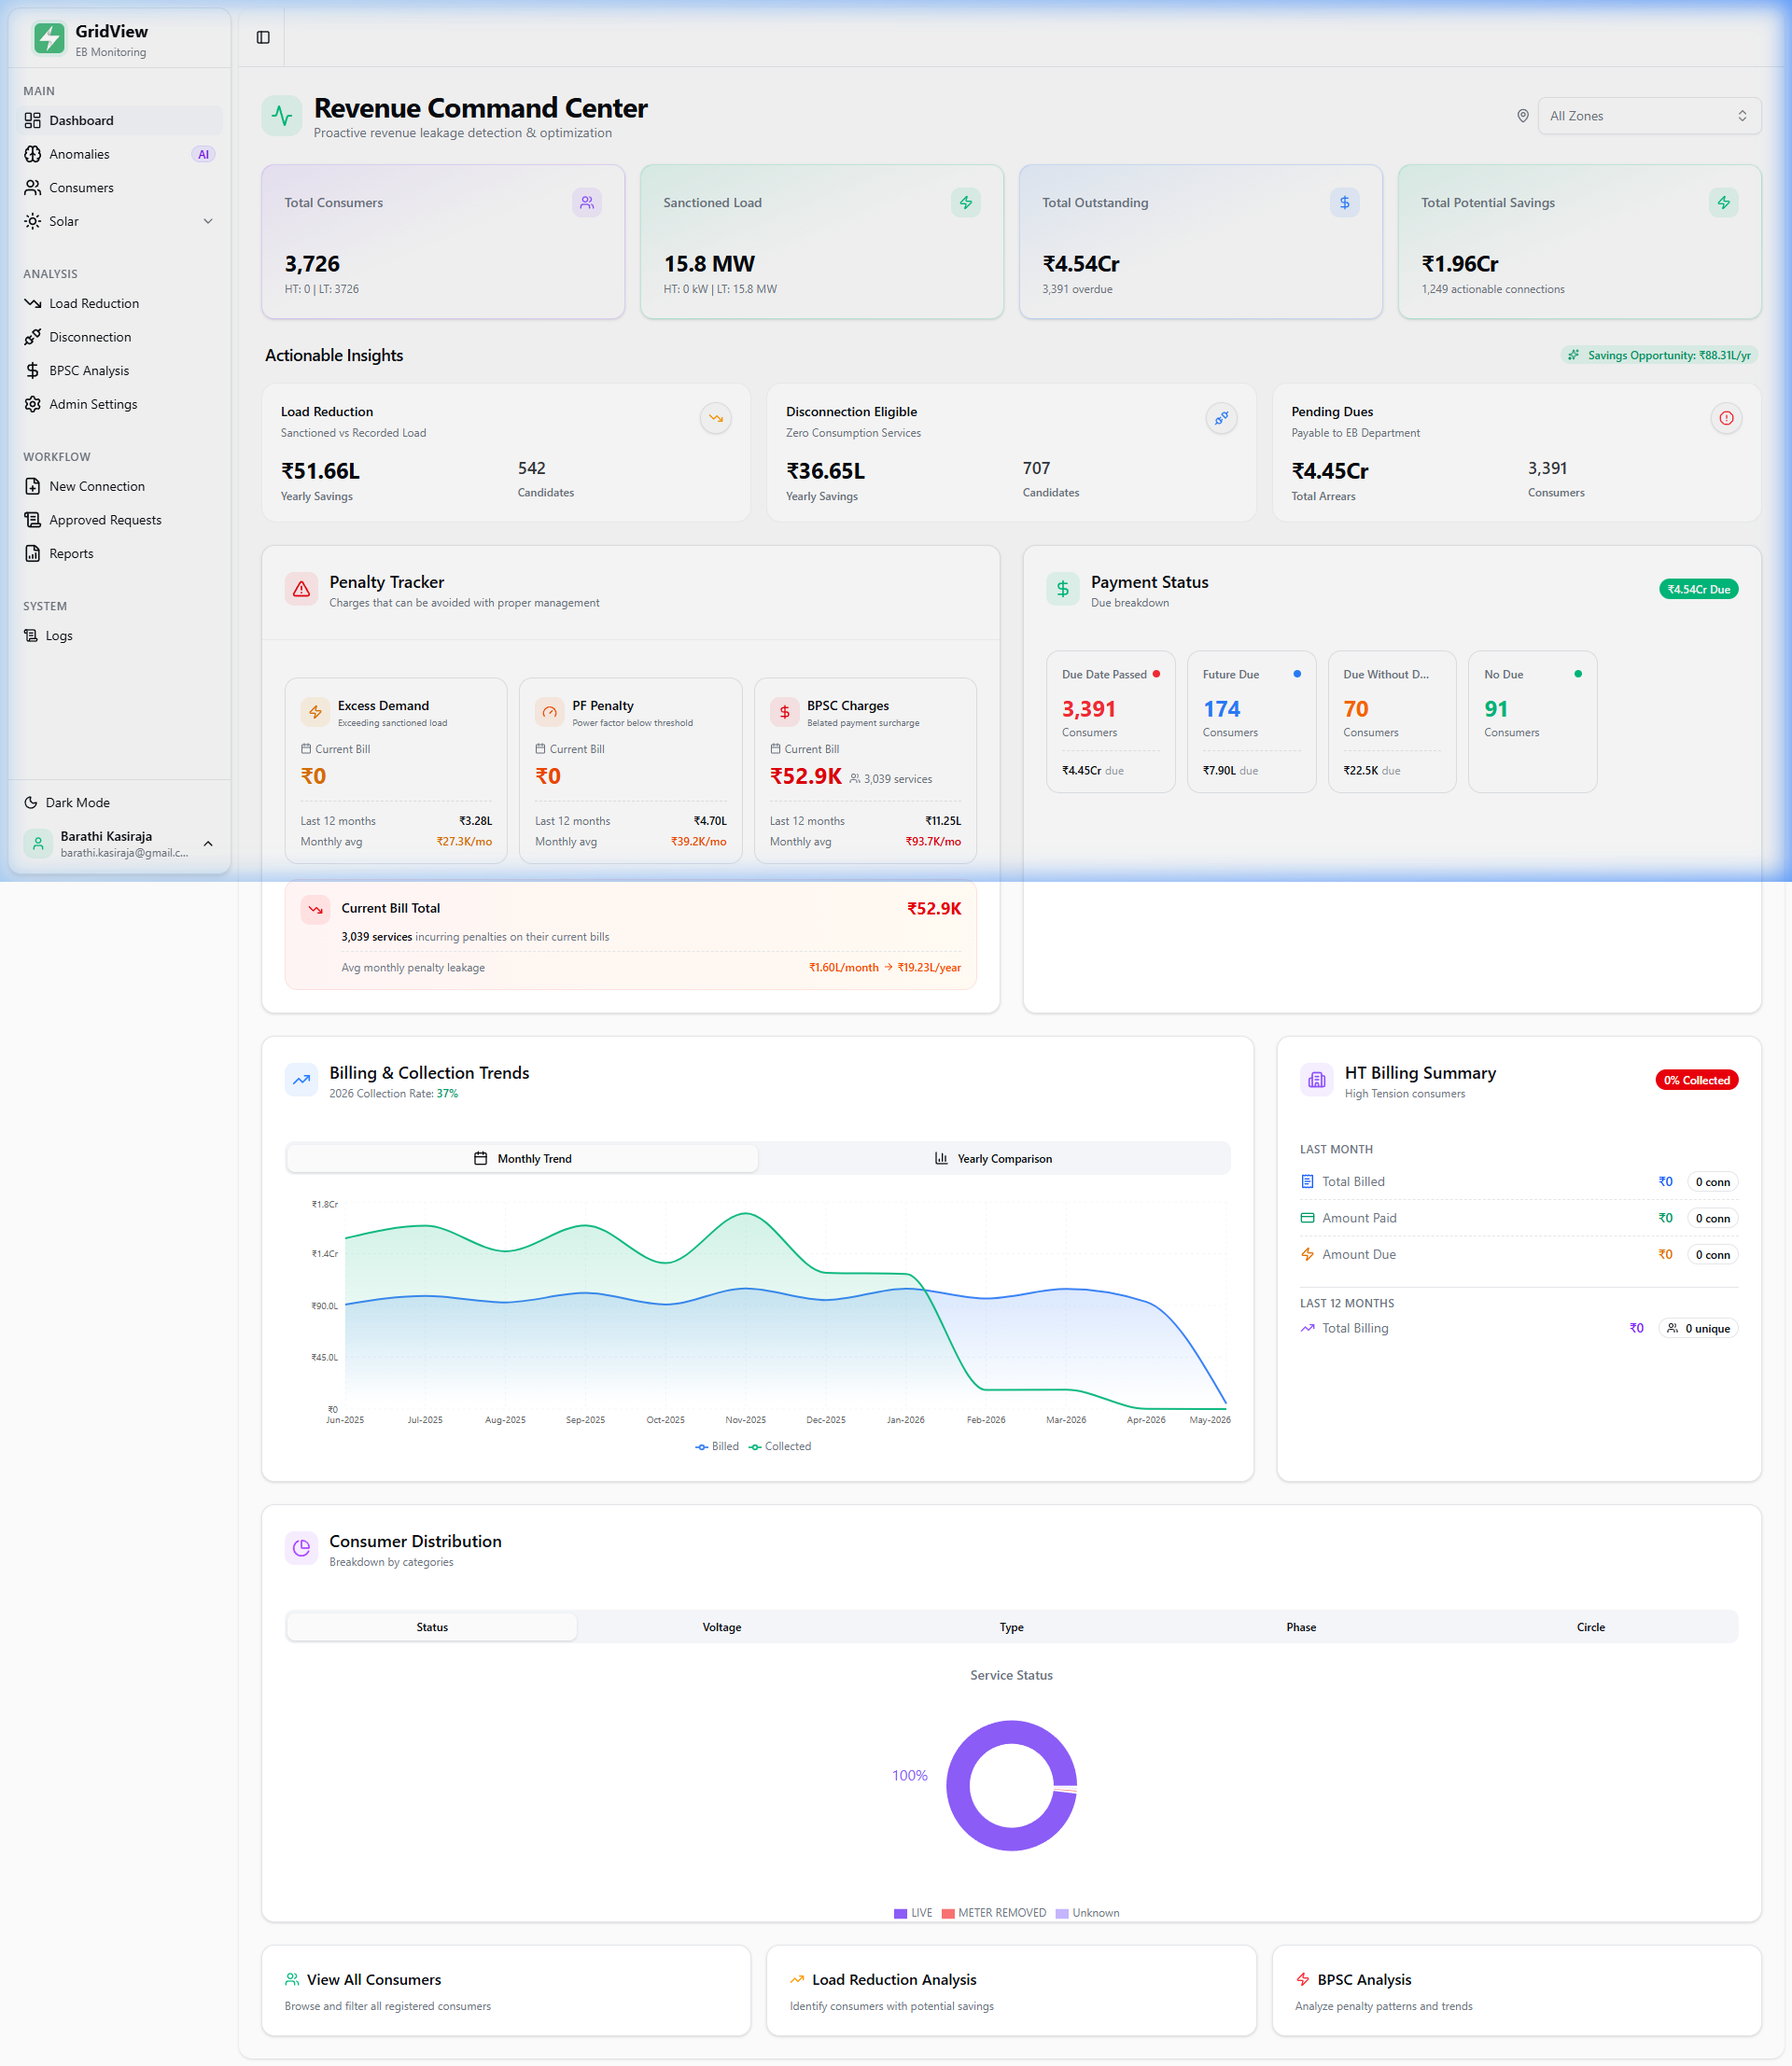
The main dashboard — a consolidated, real-time headquarters for TCMC's entire electricity cost portfolio. Every leakage category is visible at a glance.
Highlighted Sections
Hover over the highlighted areas on the screenshot to see what each panel does.
Portfolio-level totals: connections, load, dues, savings potential
Three leakage categories with quantified annual savings estimates
Excess Demand, PF Penalty, BPSC — all from actual bill data
How TCMC's TNEB liability is distributed (due / future / no due)
Monthly billed vs collected — tracks BPSC exposure growth
AI Anomaly Detection
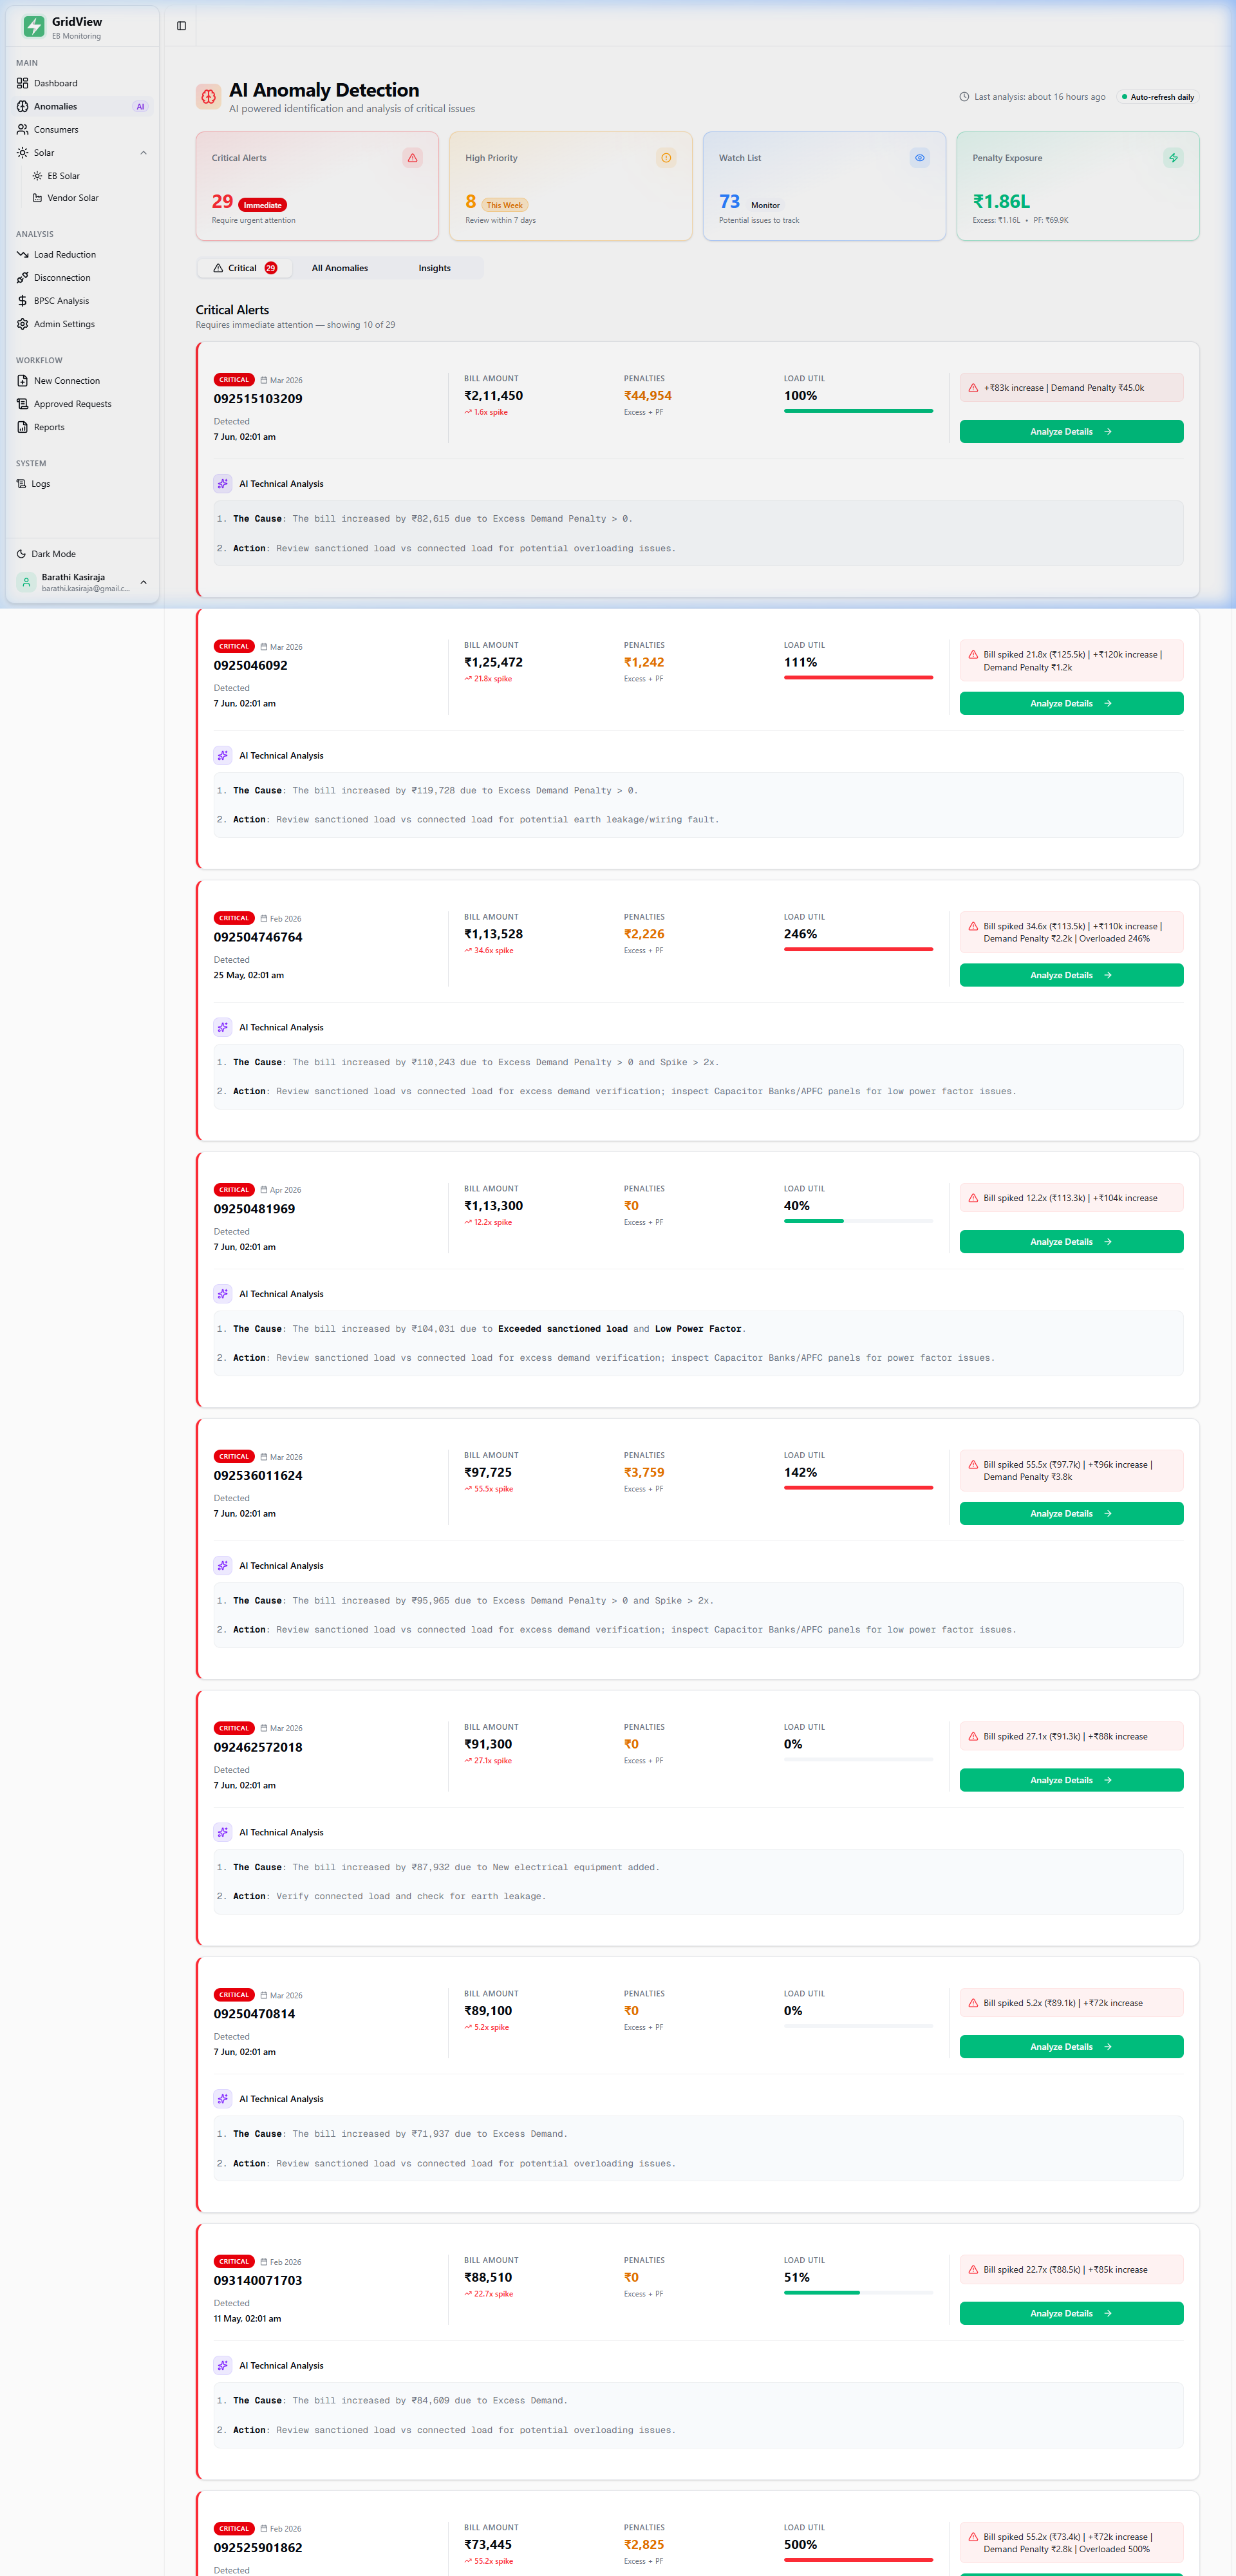
Without automation, an unusual spike on a single connection would stay buried in 2,82,000+ bill records. The AI engine surfaces critical irregularities within 24 hours of new data arrival — with a cause and a recommended action already written.
Immediate Action Required
Connections with severe demand spikes, overloaded circuits, or penalty jumps exceeding ₹40,000 in a single bill. Each alert includes AI-written root-cause analysis and corrective action.
Review Within 7 Days
Emerging patterns that need attention before they escalate — repeated demand overruns, power factor deterioration, or newly surfaced BPSC exposure.
Trend Monitoring
Connections showing early warning signals that are being tracked. If unchecked, these typically escalate to Critical within 1–2 billing cycles.
Consumers Registry
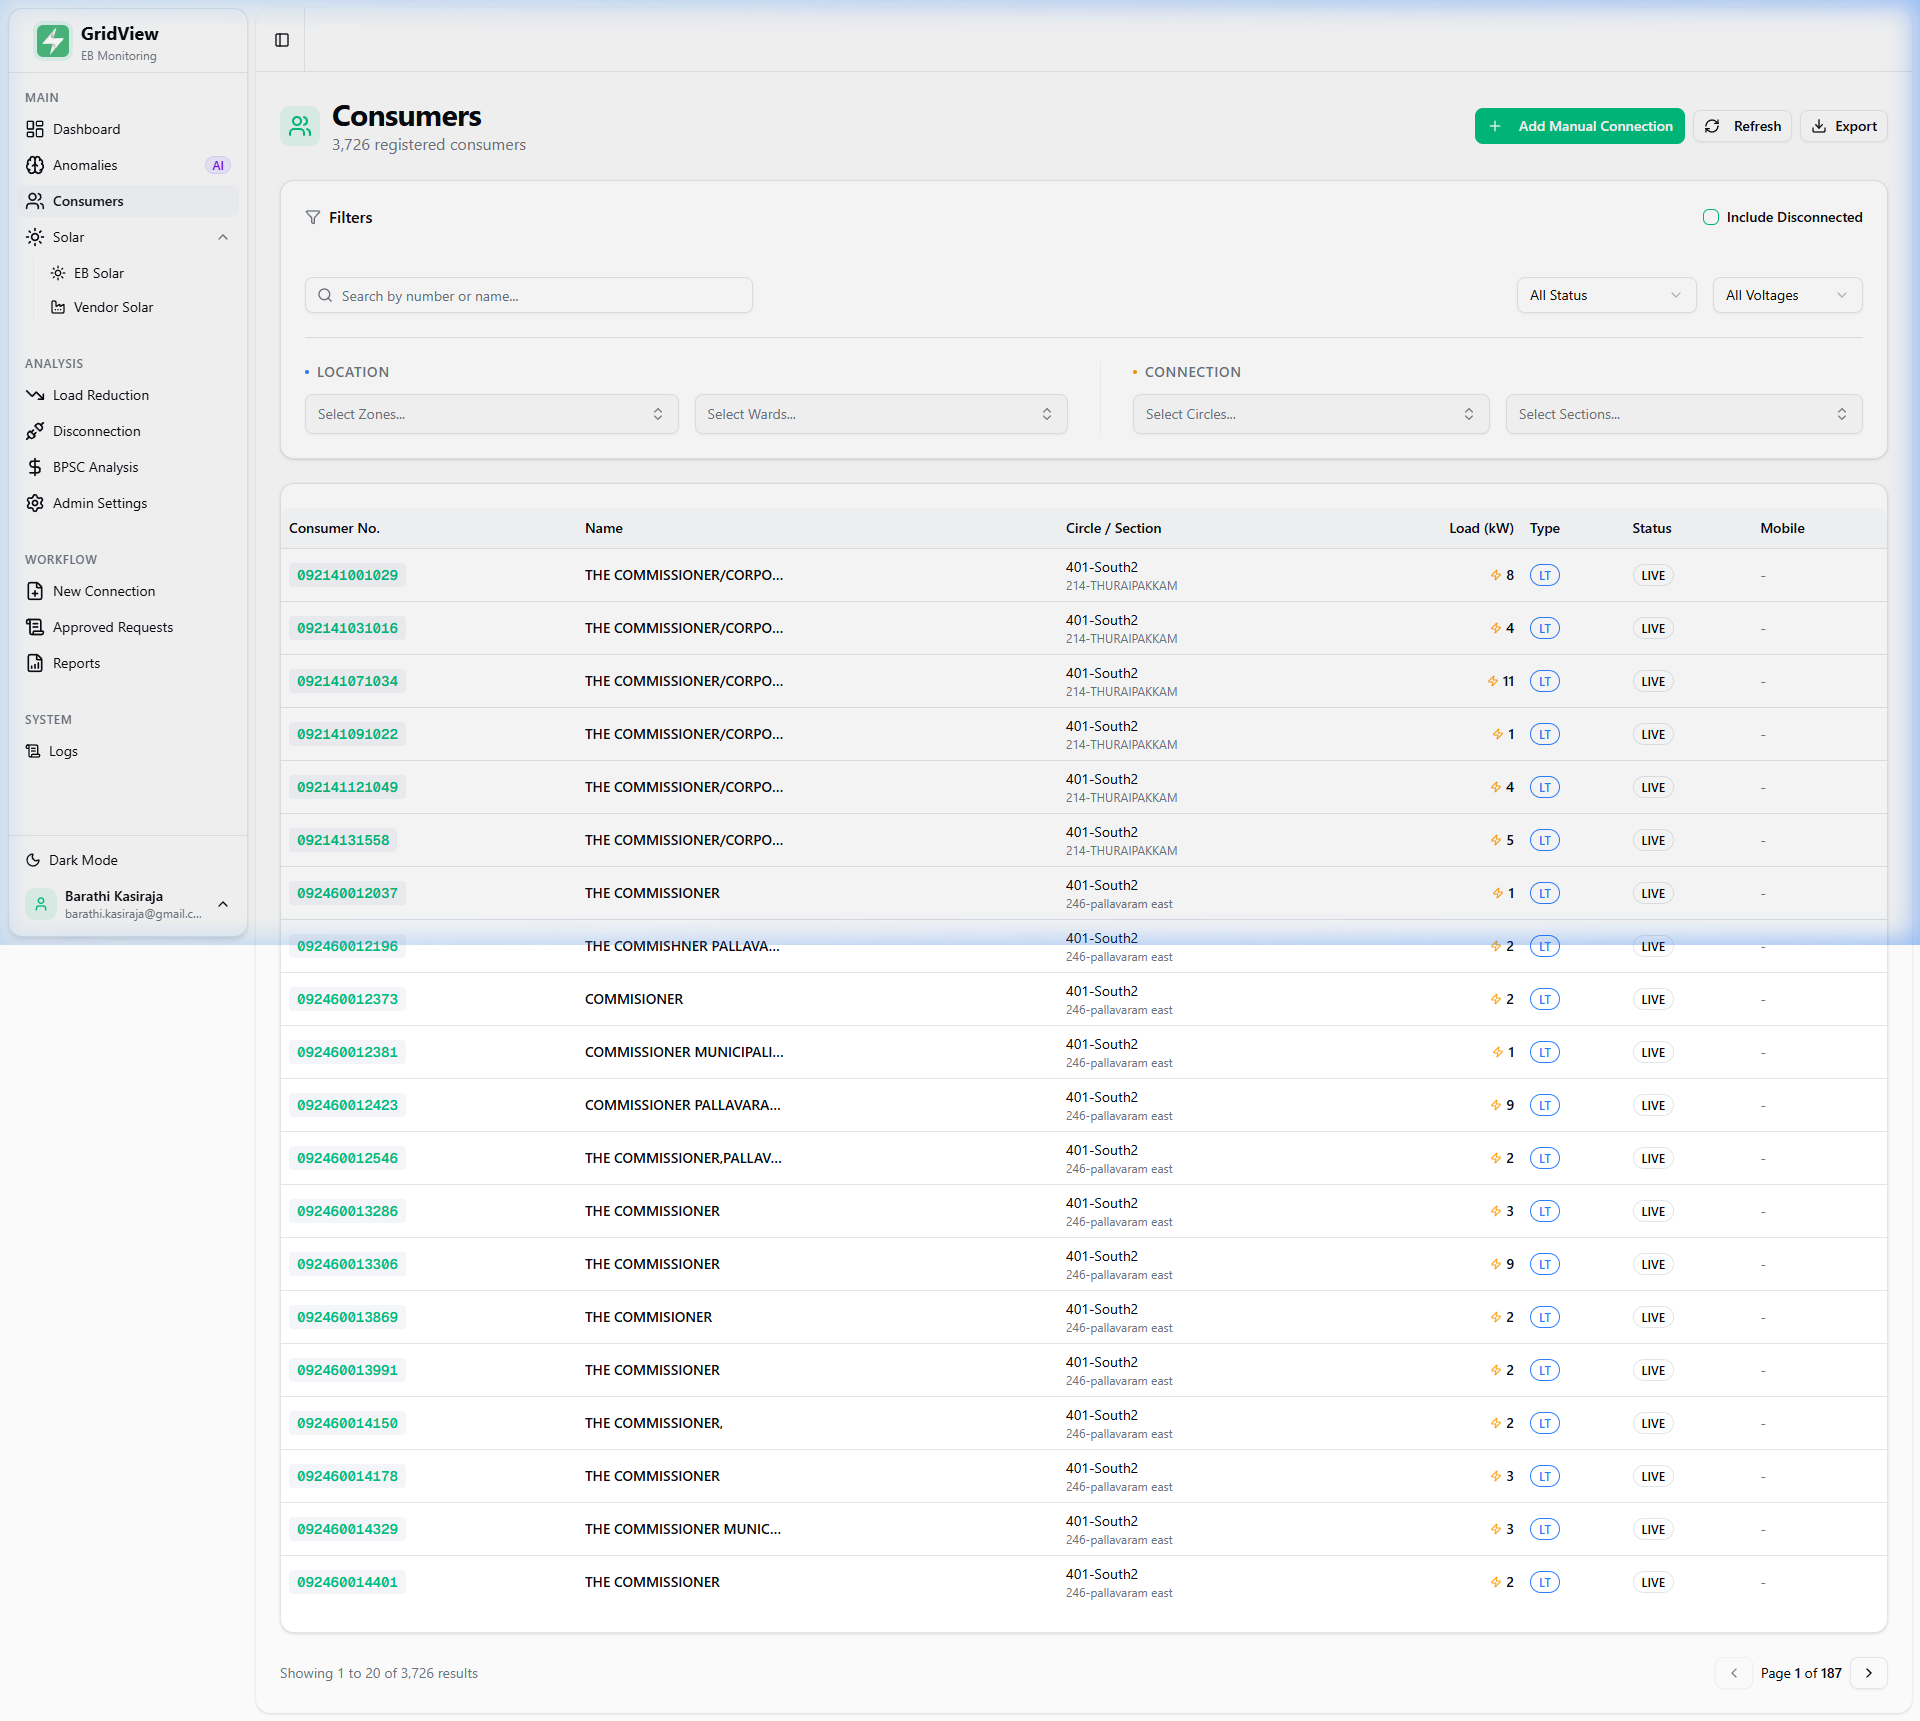
Master registry of all 3,726 TNEB service connections under TCMC. The starting point for investigating any specific connection — from sanctioned load to full billing history.
Load Reduction Analysis
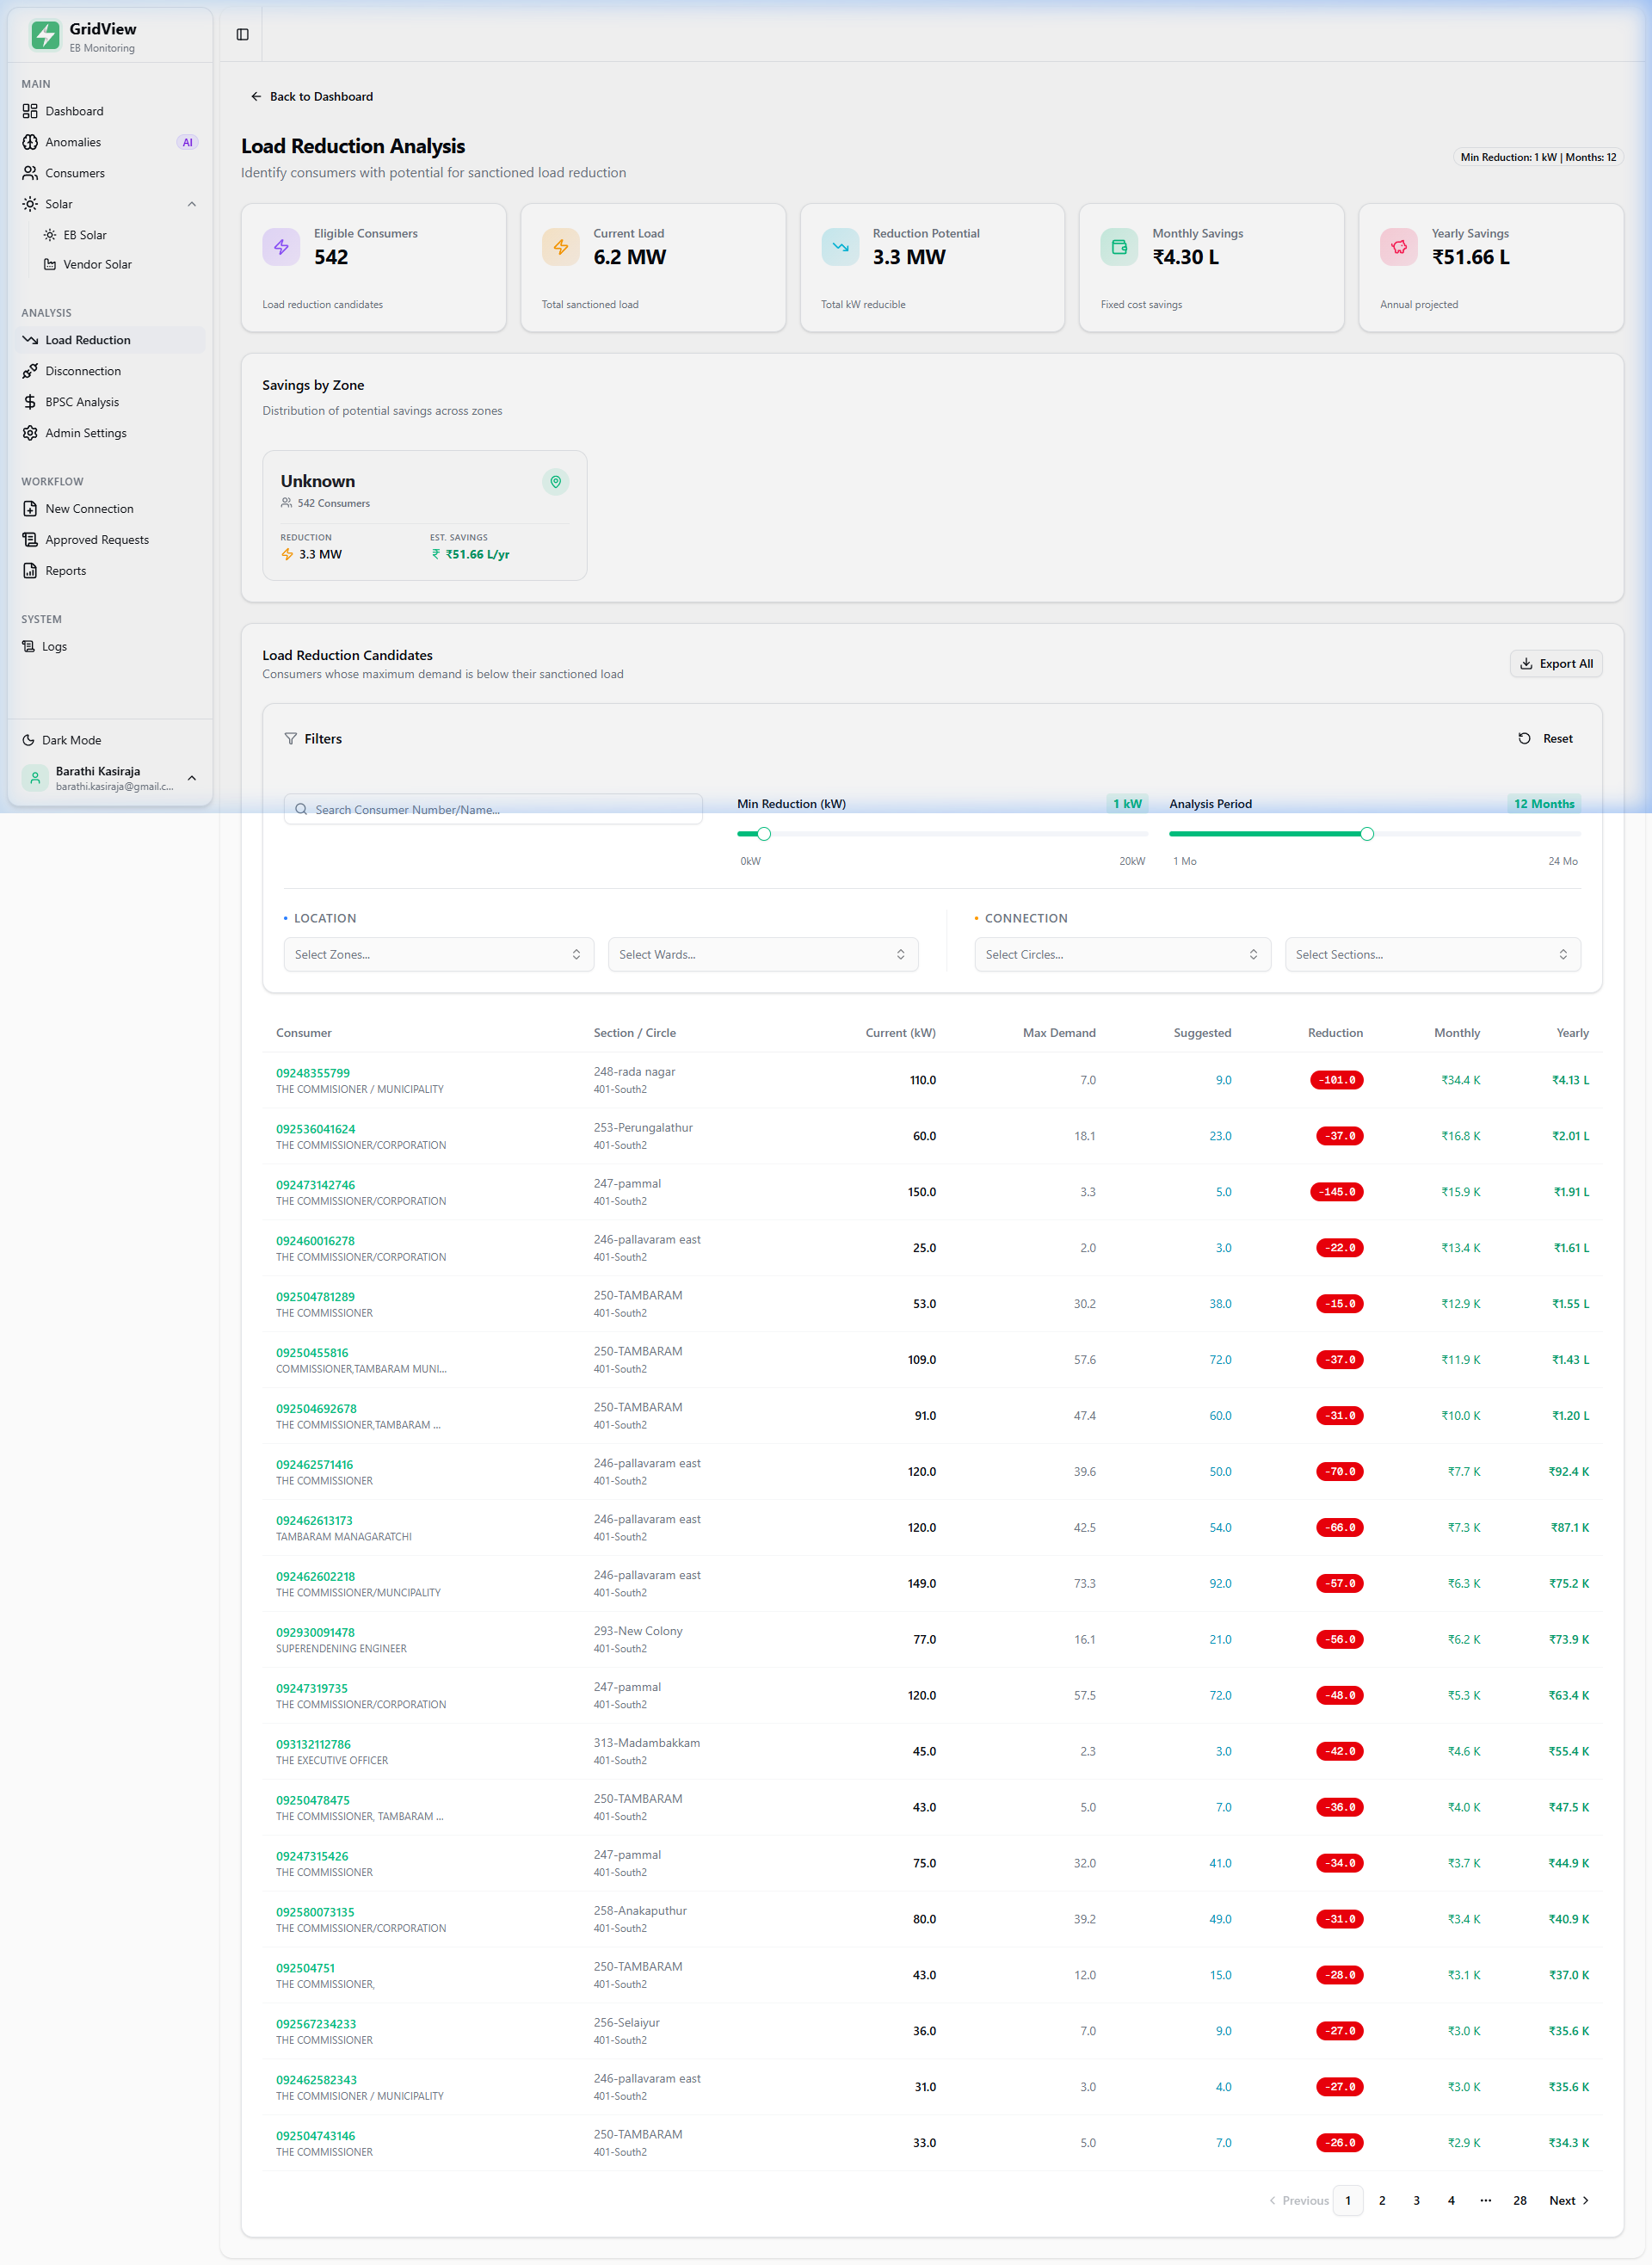
TNEB charges a fixed demand component on the sanctioned load — the contracted kW capacity — regardless of how much TCMC actually uses. When 100 kW is sanctioned but only 10 kW is ever drawn, the Corporation pays the fixed charge on 90 kW of wasted capacity every single month.
How It Works
The system analyses up to 24 months of actual bill history per connection. The highest recorded demand across the analysis window becomes the baseline. A suggested new sanctioned load is set slightly above this maximum — providing a buffer — and the difference is the reducible kW.
Municipality 110 kW 7.0 kW 9.0 kW ₹4.13 L
Corporation 60 kW 18.1 kW 23.0 kW ₹2.01 L
Corporation 150 kW 3.3 kW 5.0 kW ₹1.91 L
Zero Unit Analysis
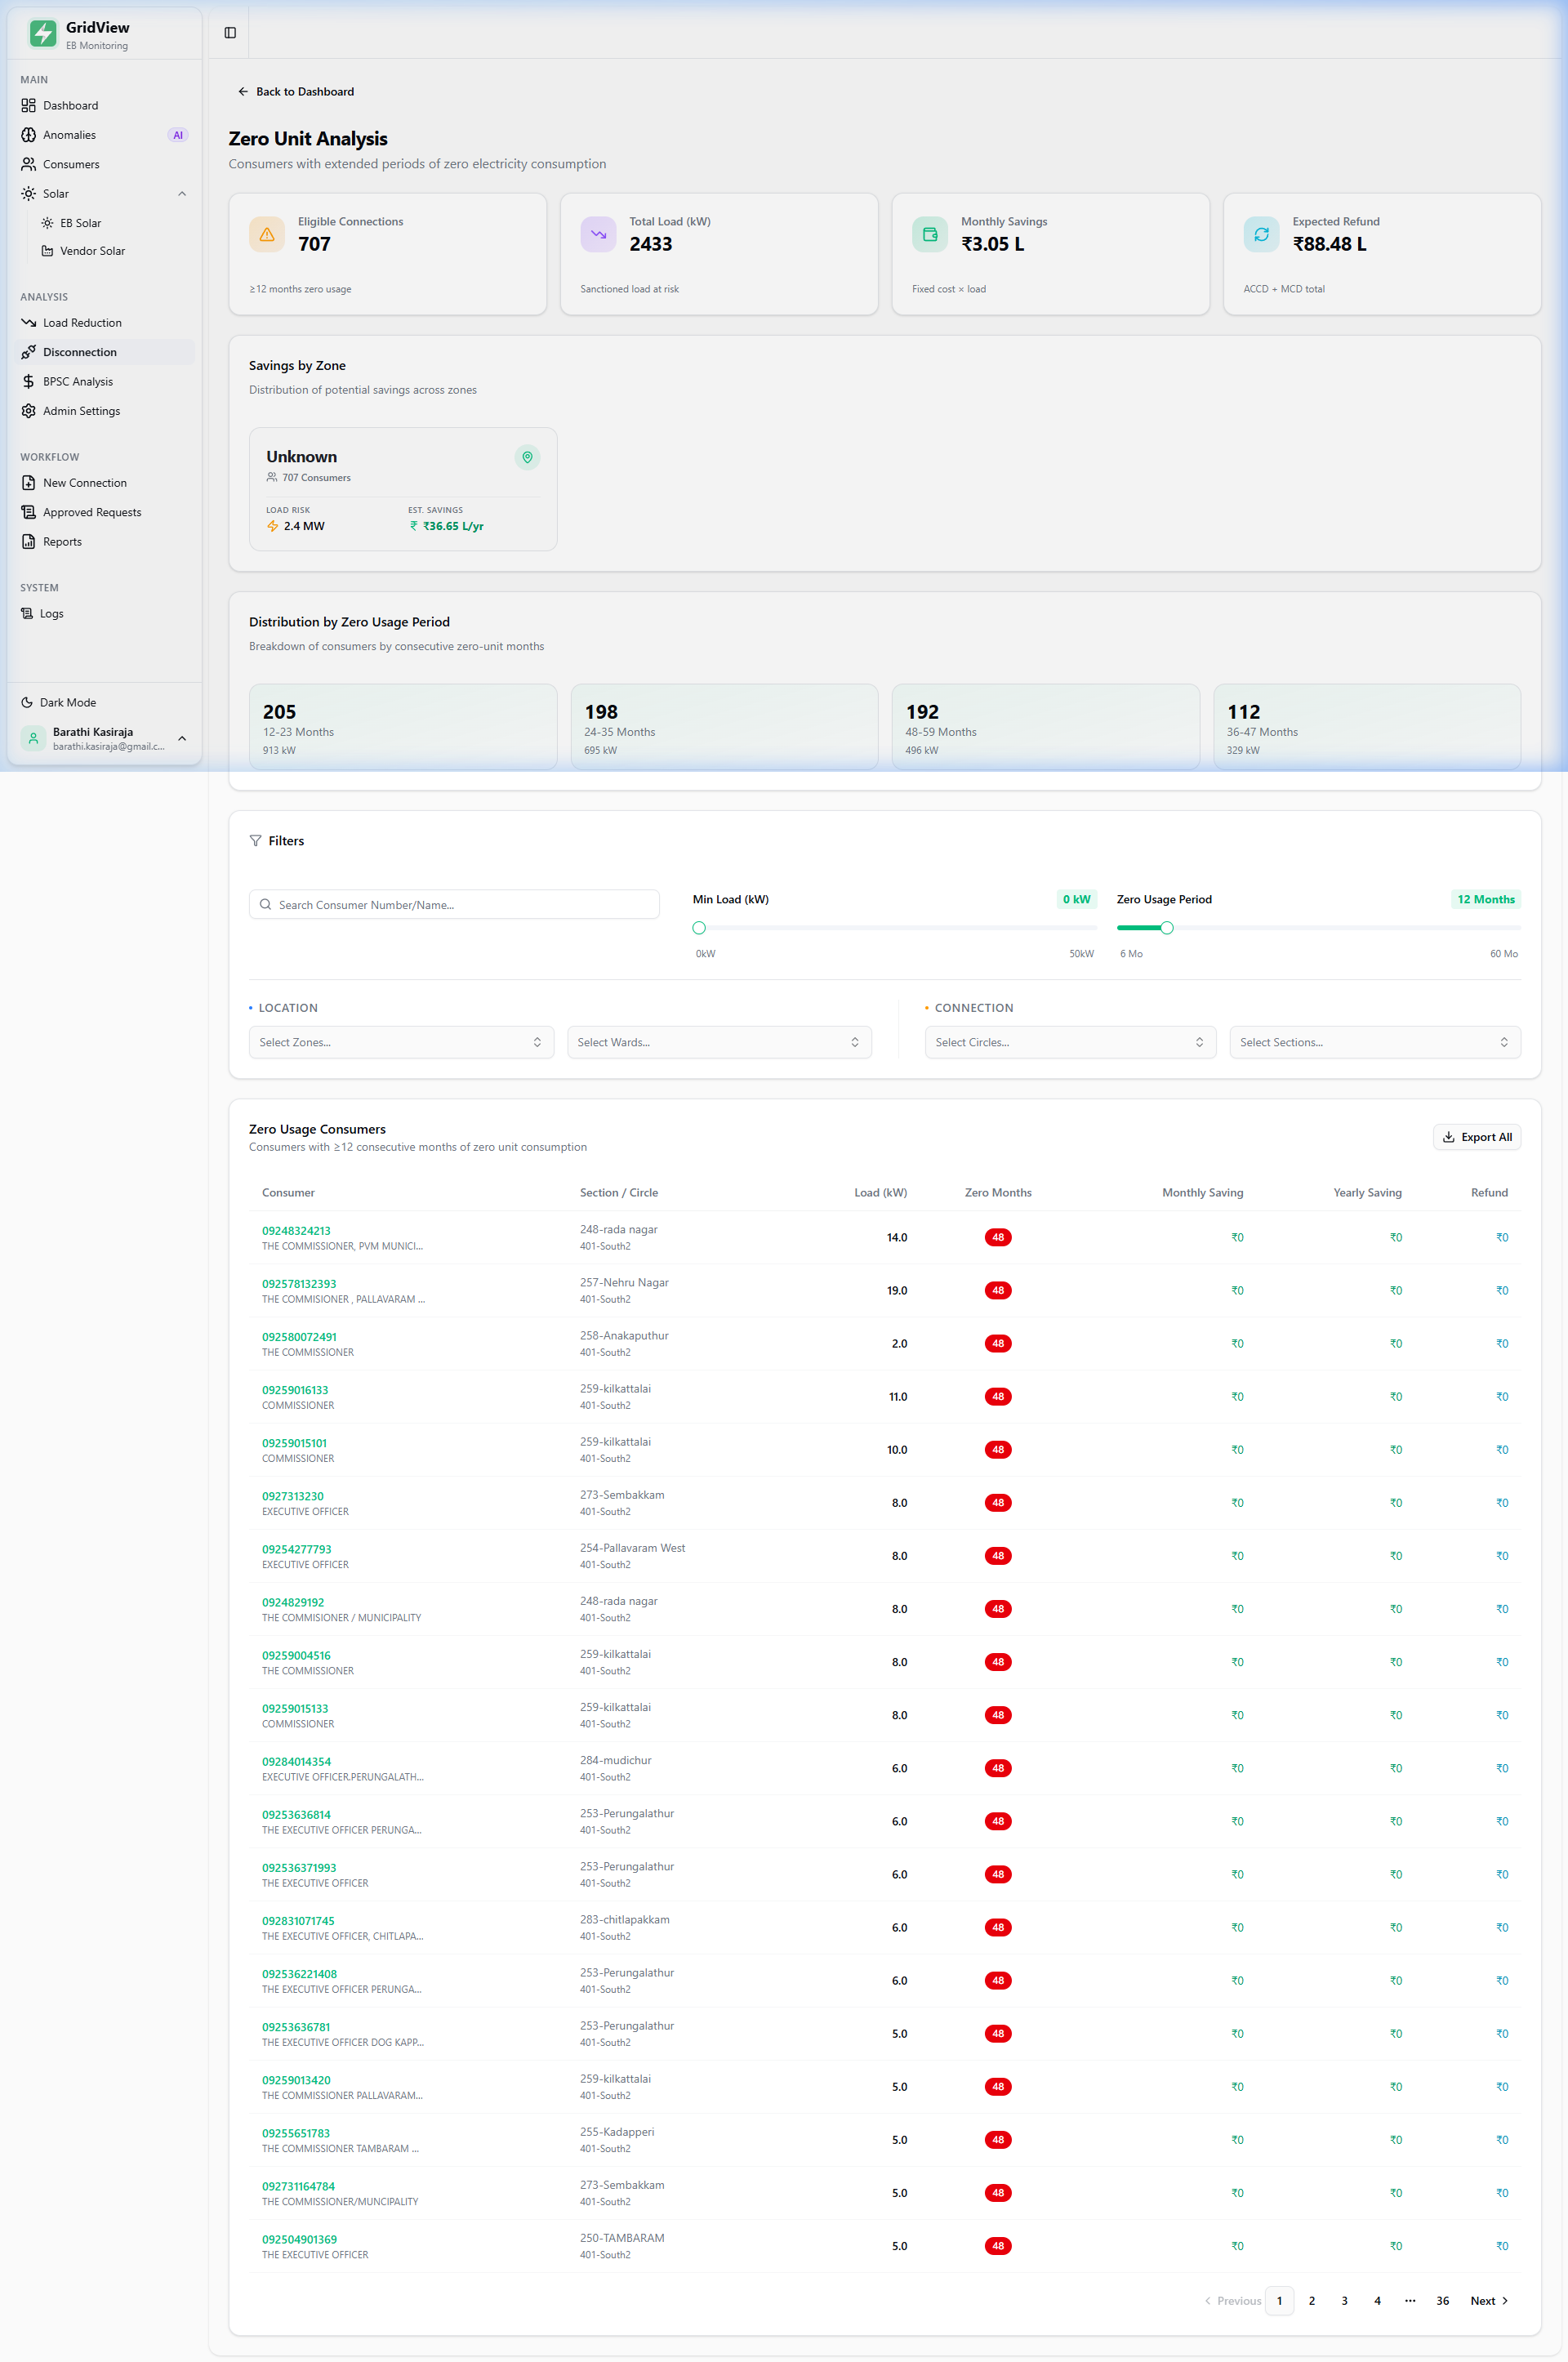
TNEB charges a minimum fixed cost (ACCO + MCD) on every live connection — even those with zero electricity consumption. TCMC currently has 707 connections that have recorded zero consumption for 12 or more consecutive months, yet continue paying these minimum charges.
The Two Financial Benefits
Recurring Savings — ₹36.65 L/year
Once dormant connections are formally disconnected, the monthly minimum charge obligation ceases immediately. At 707 connections, this is approximately ₹3.05 L saved every month after disconnection.
One-Time Deposit Refund — ₹88.48 L
TNEB holds an advance deposit (ACCO + MCD) for every live connection. Upon formal disconnection, this is refundable. For 707 connections, this represents a one-time cash recovery of over ₹88 lakhs — a significant capital infusion.
BPSC Analysis
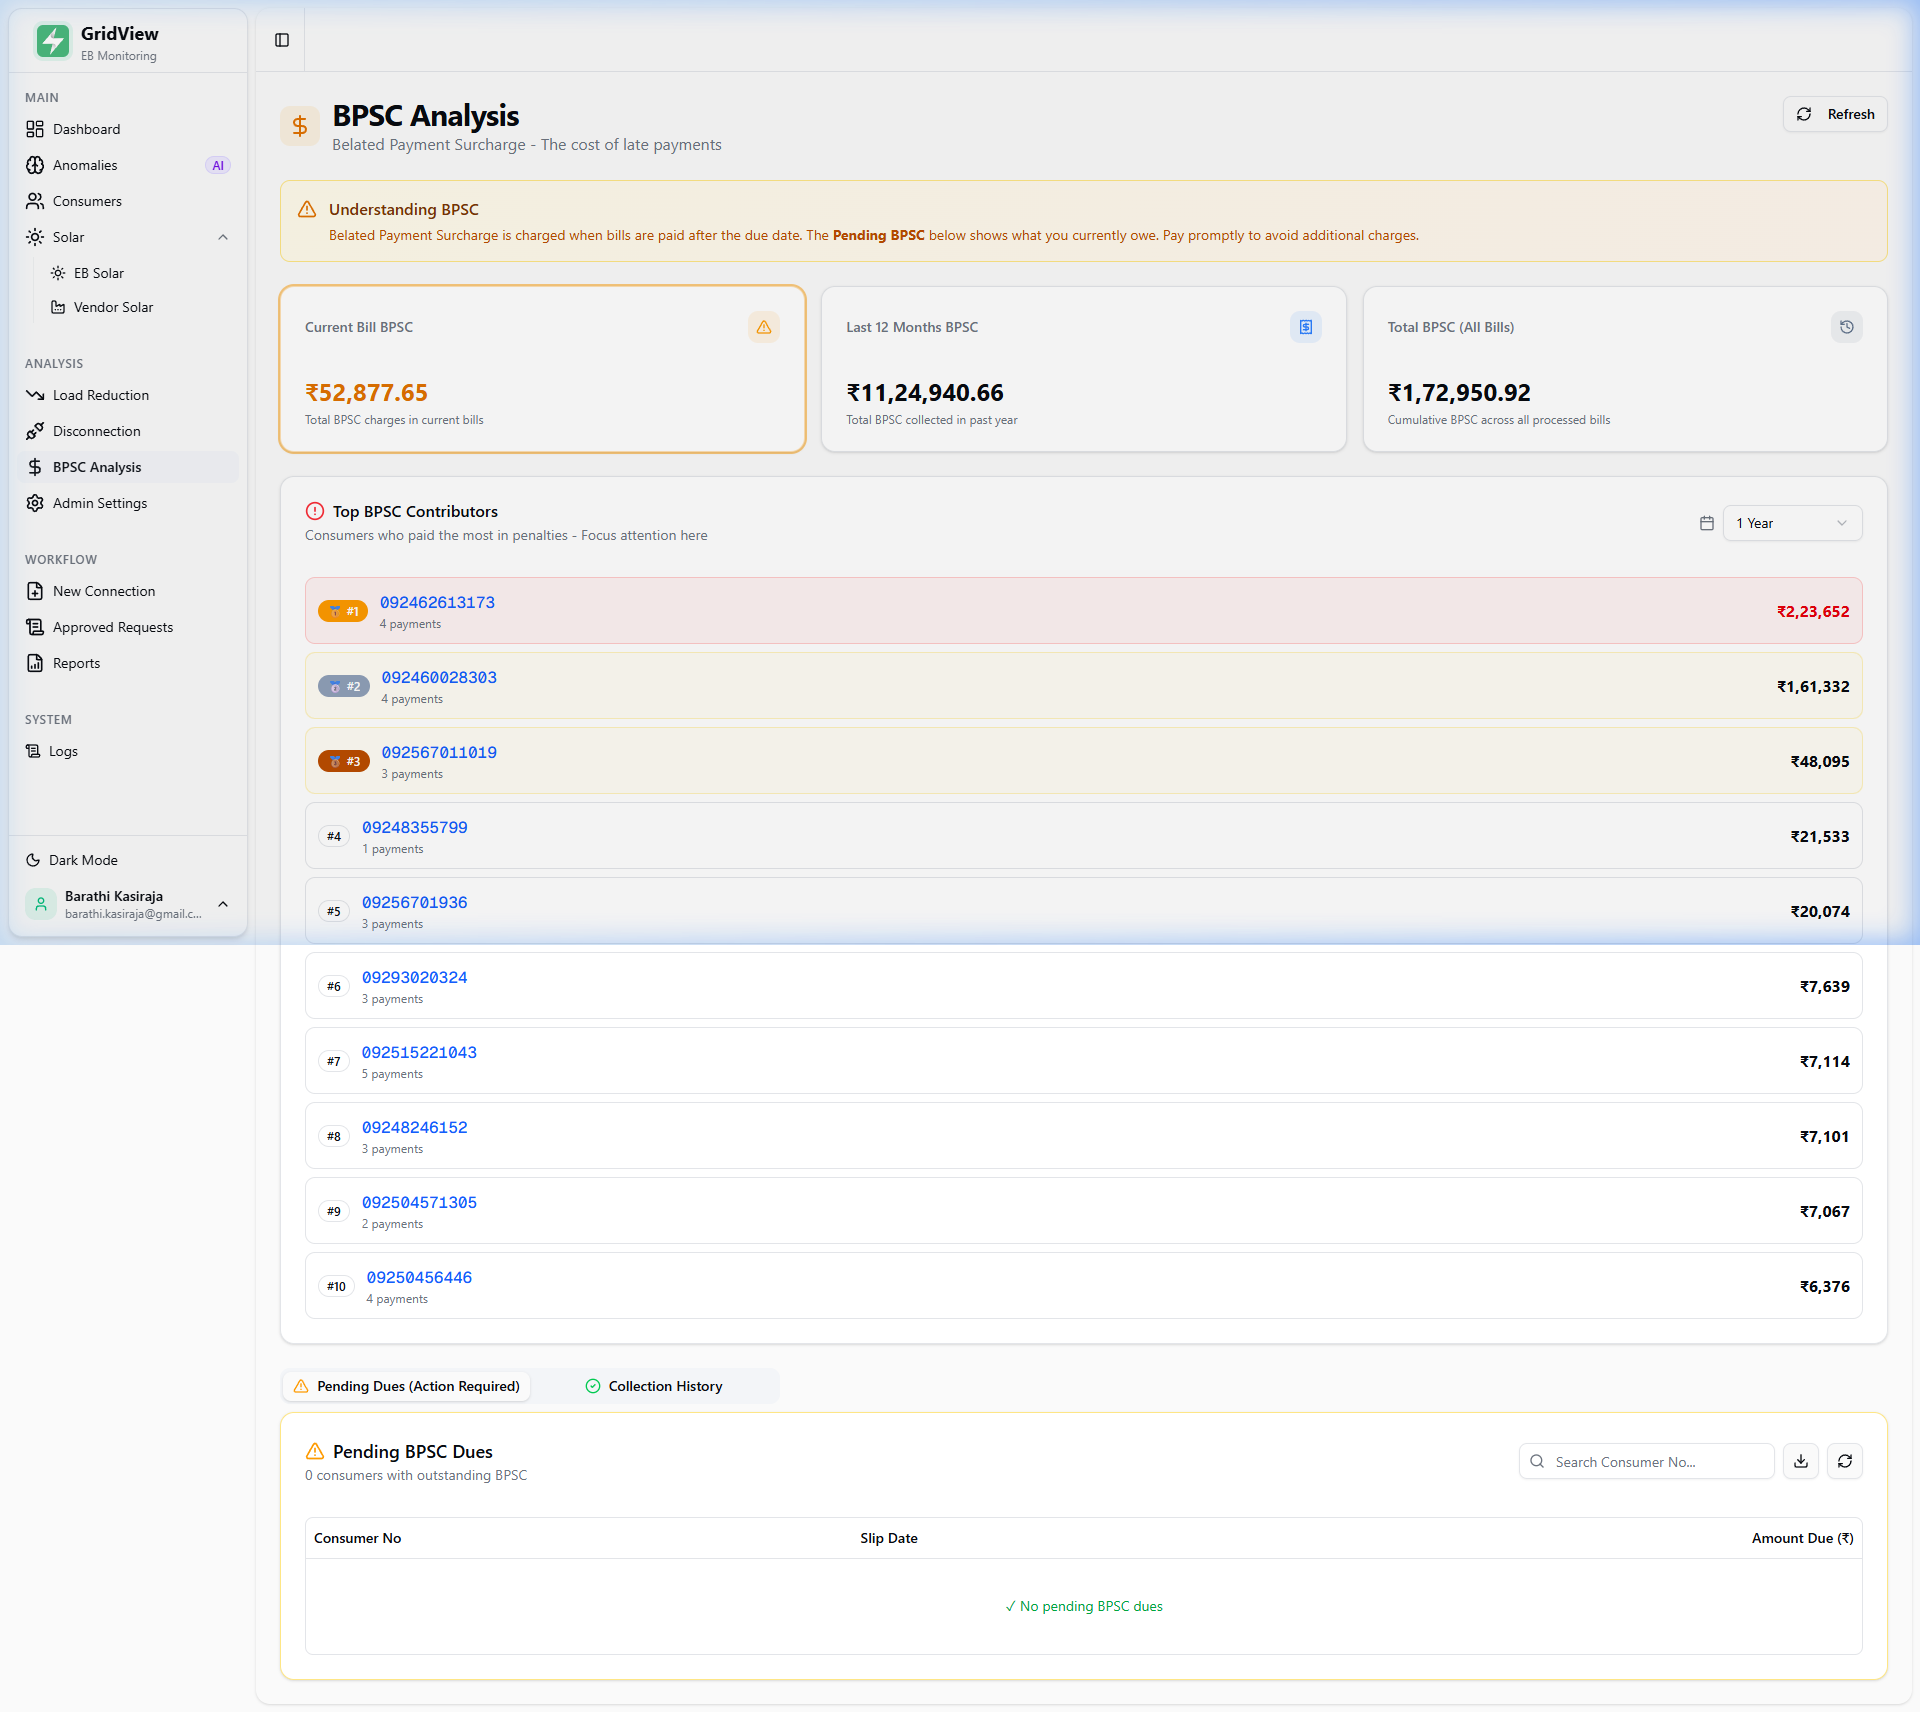
Belated Payment Surcharge (BPSC) is charged by TNEB when bills are paid after the due date. It compounds with every passing billing cycle, making the cost of delay exponential. This module tracks every rupee of BPSC across all 3,726 connections — and who is driving it.
Top BPSC Contributors
The leaderboard identifies which service connections are generating the most BPSC. Prioritising payment on these specific accounts delivers the highest immediate reduction in penalty accrual.
Solar Monitoring
Tracks both TCMC-owned solar installations (net metering) and vendor-supplied solar (RESCO/PPA), showing actual units offset and cost savings relative to TNEB tariff.
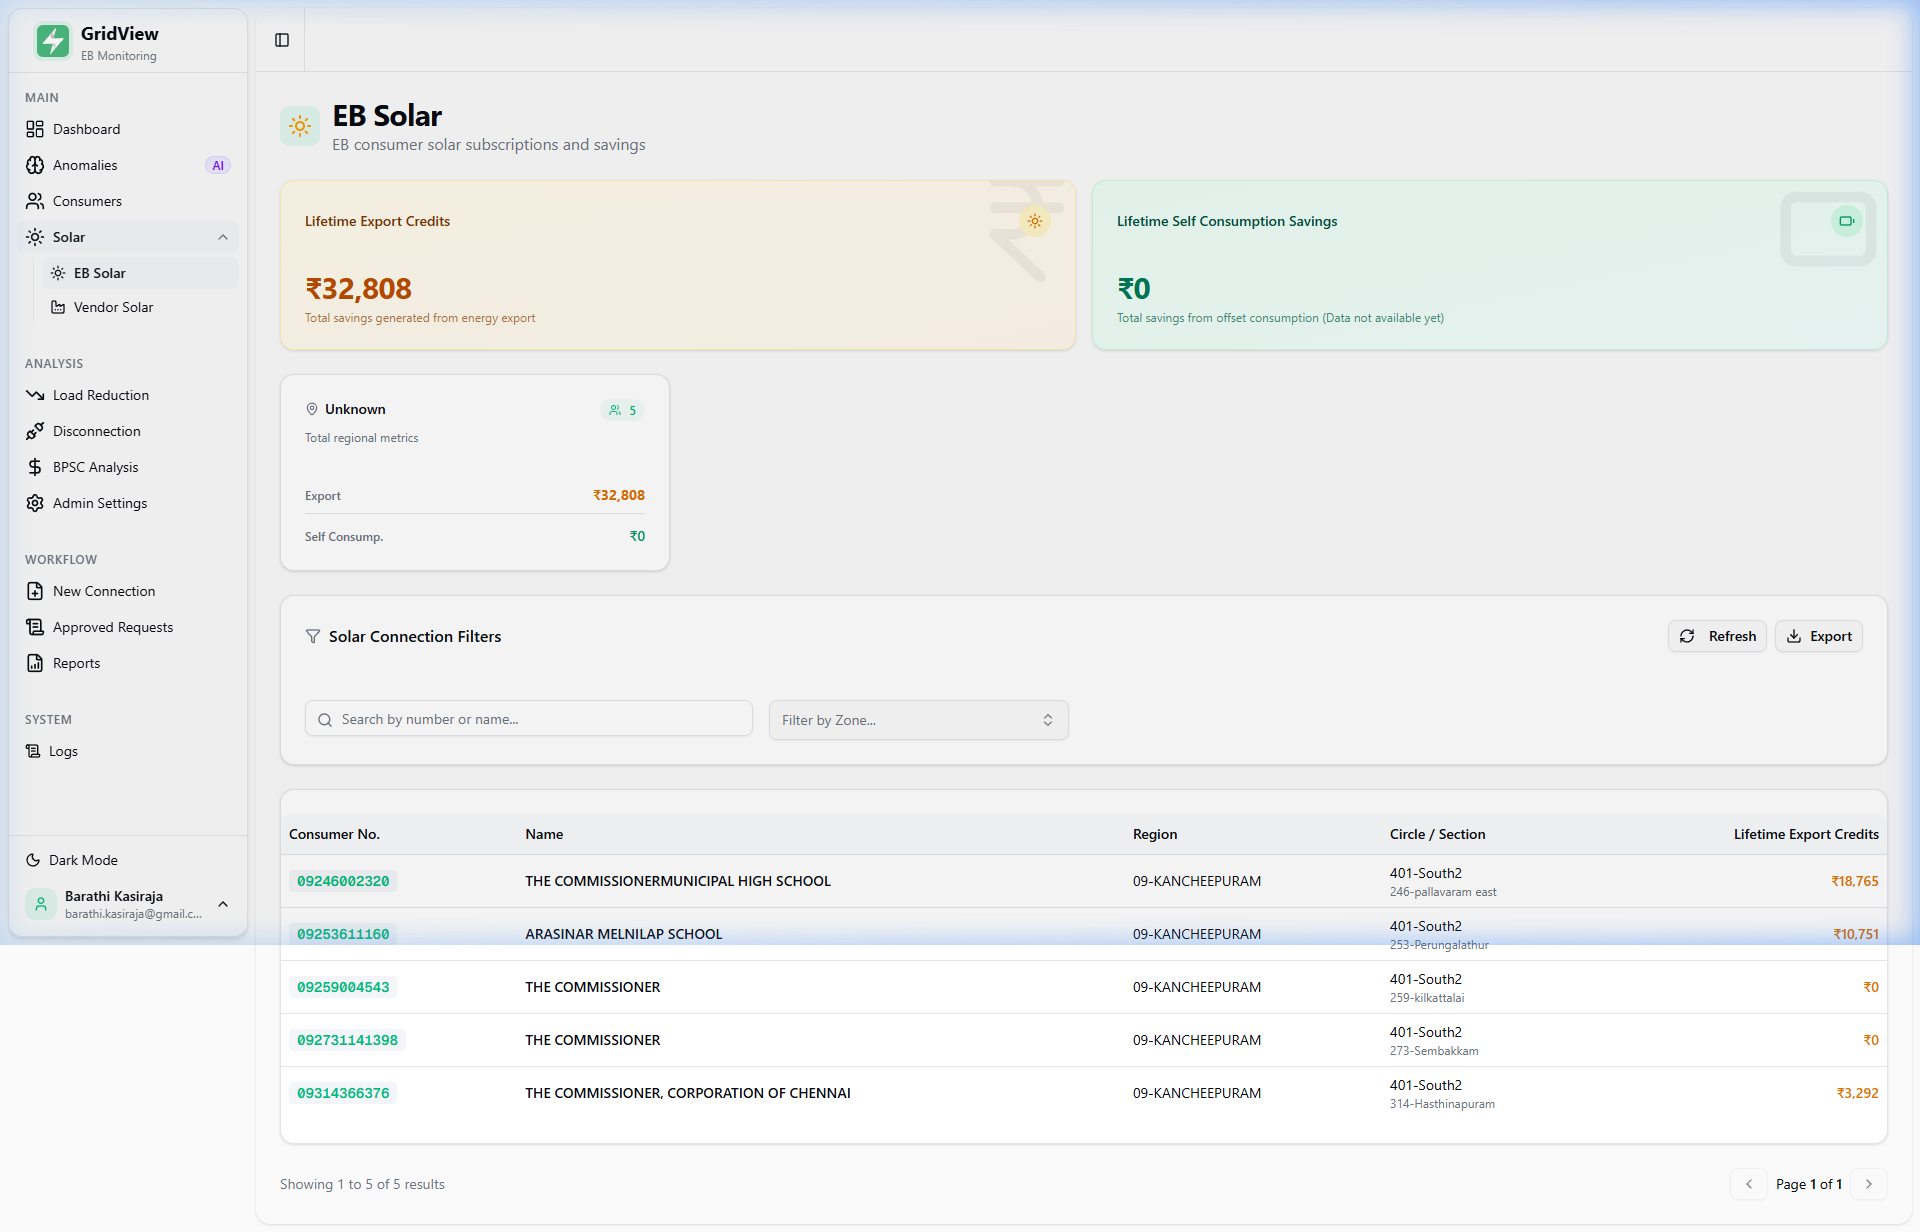
EB Solar (Net Metering)
TCMC-owned solar panels feed surplus generation back into the TNEB grid. The dashboard tracks: total units generated, units banked with TNEB, and net consumption (billed units minus solar credit). This credit directly reduces the monthly bill amount.
Vendor Solar (RESCO / PPA)
Third-party vendors supply solar power to Corporation premises under a power purchase agreement. The dashboard compares the vendor cost-per-unit against the equivalent TNEB tariff, quantifying the savings per unit of solar substitution.
Reports
Pre-built, exportable reports for daily administration and action tracking — each filterable by Zone, Ward, Circle, and Section.
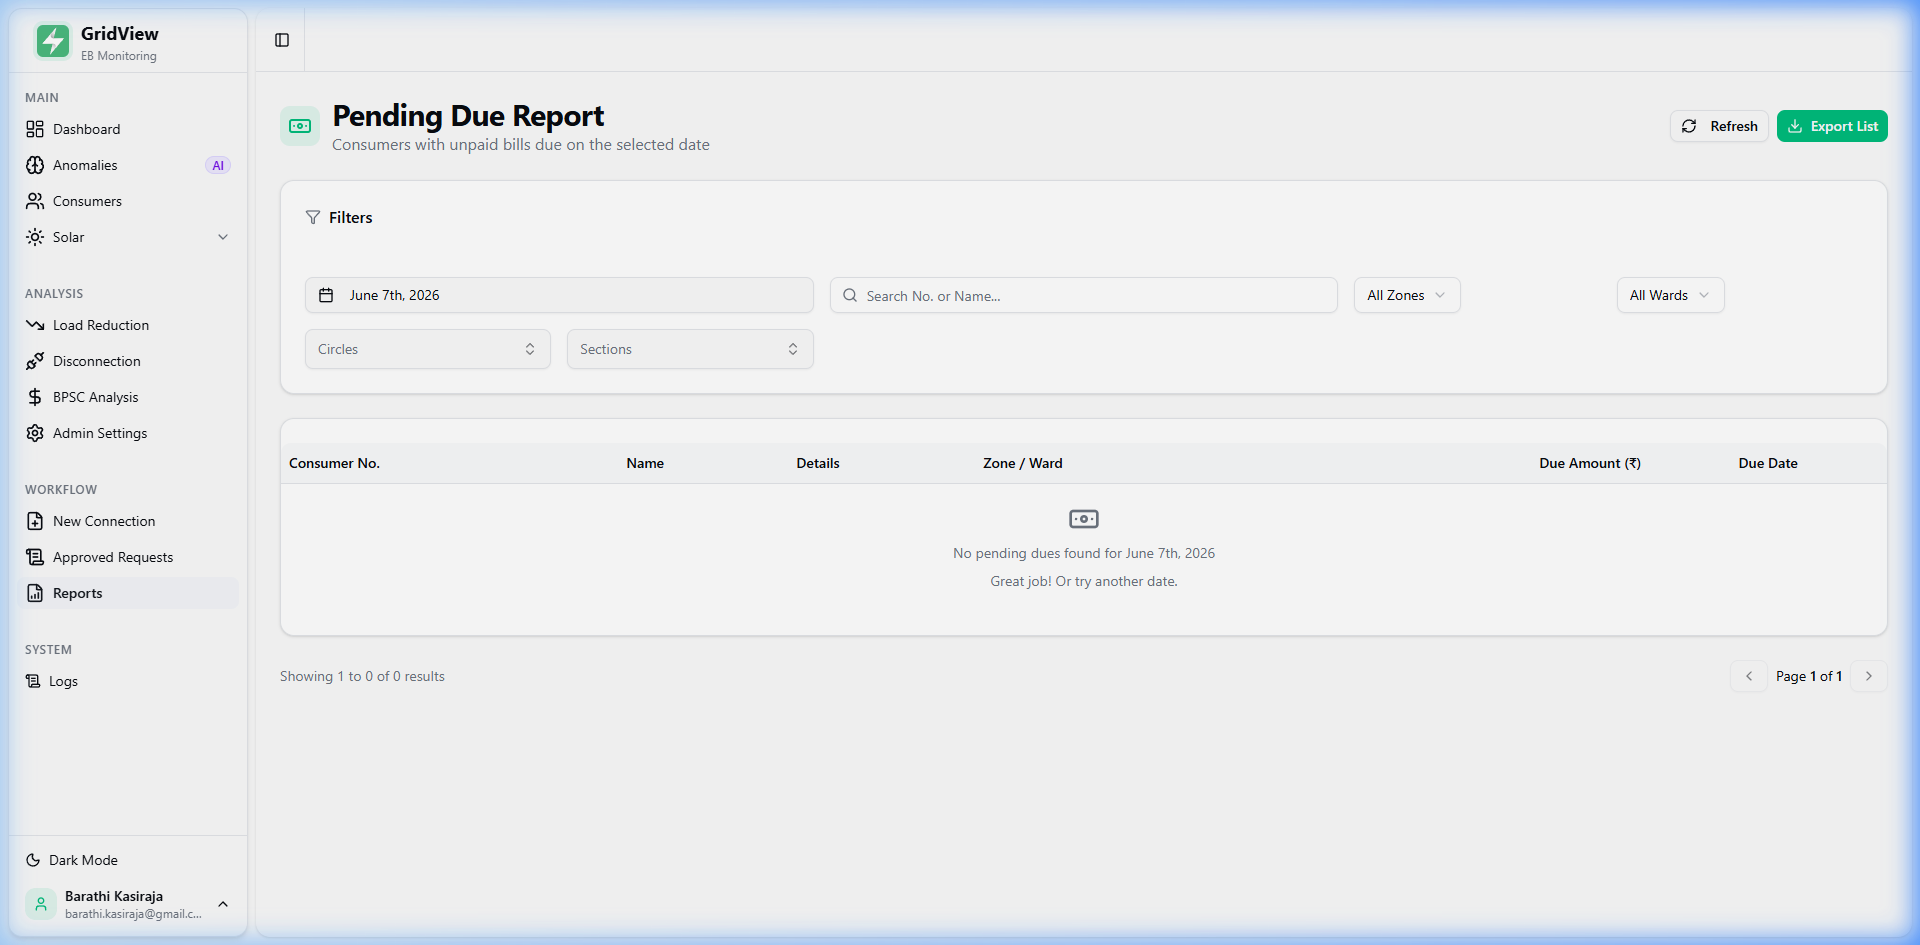
Pending Due Report
All consumers with unpaid TNEB bills as of any selected date. The primary daily tool for the finance team to manage collections and flag accounts for follow-up before BPSC accrues.
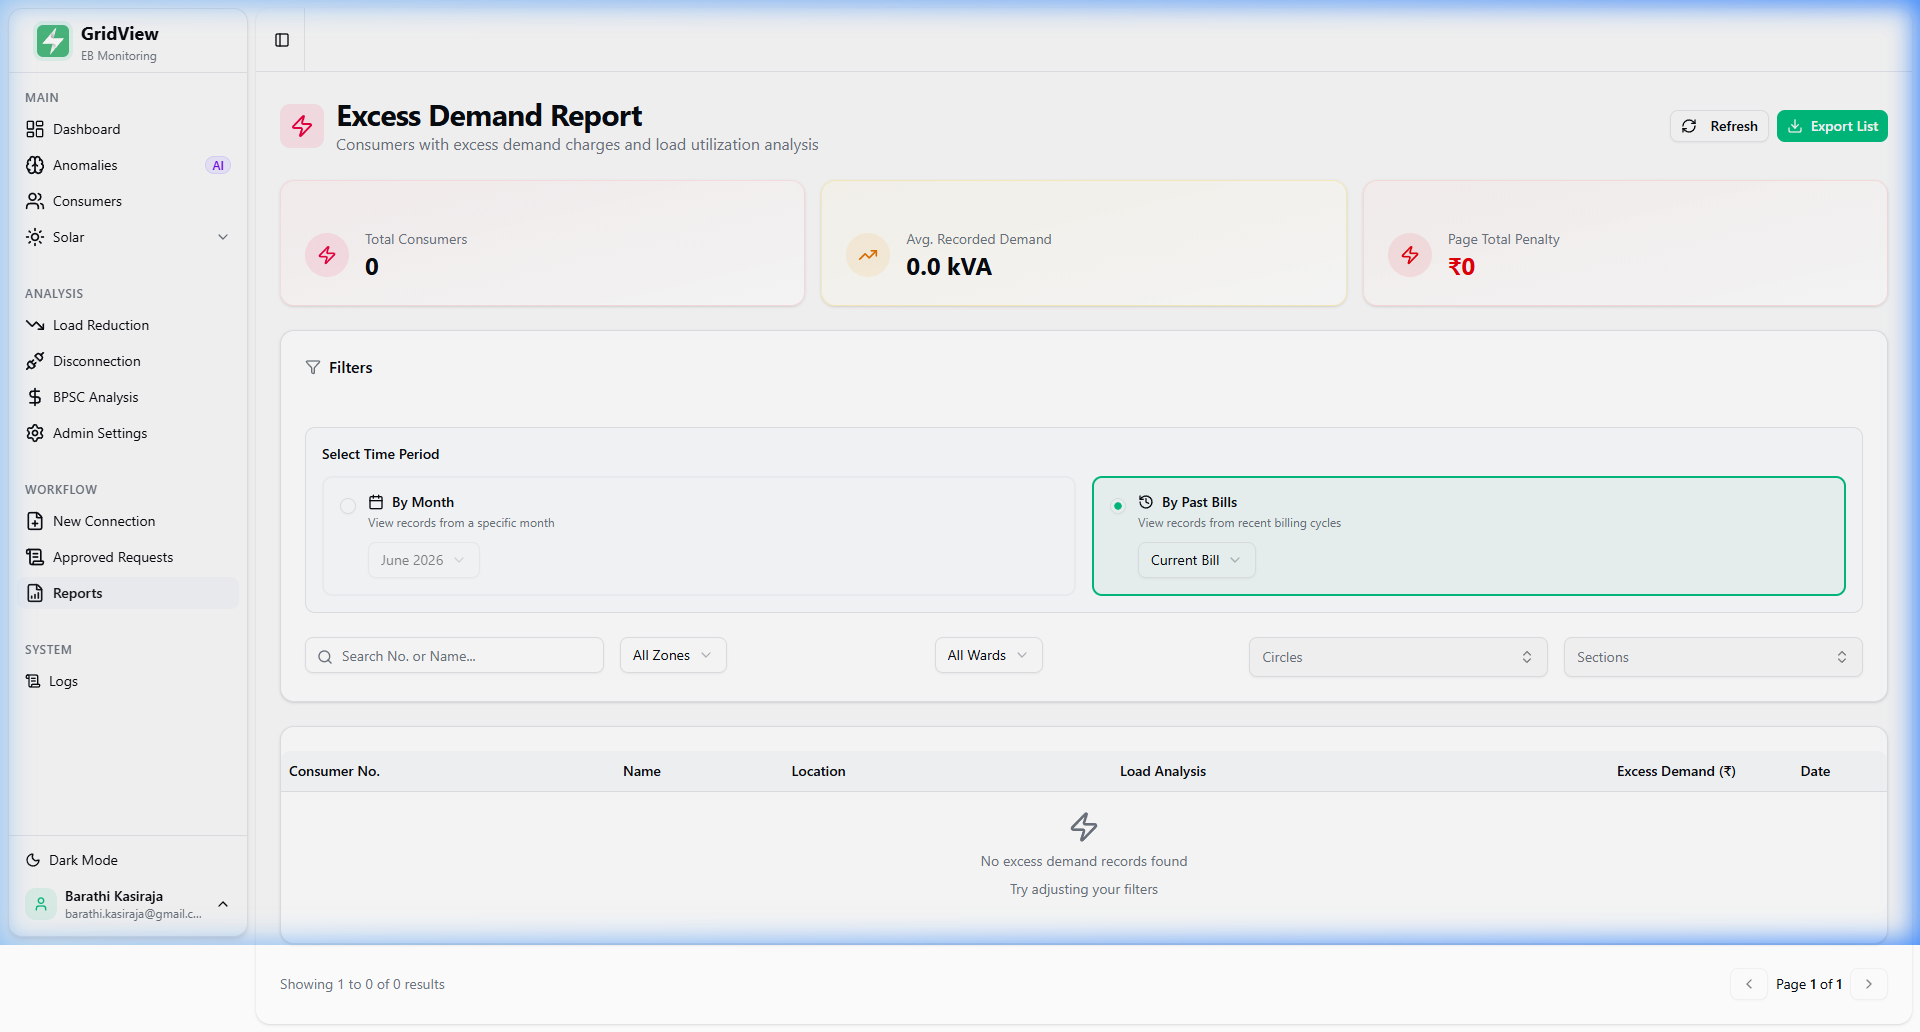
Excess Demand Report
All connections that incurred Excess Demand penalty in the latest bill cycle. Shows the gap between sanctioned load and recorded demand, and the resulting penalty. Feed this directly into site-level engineering review.
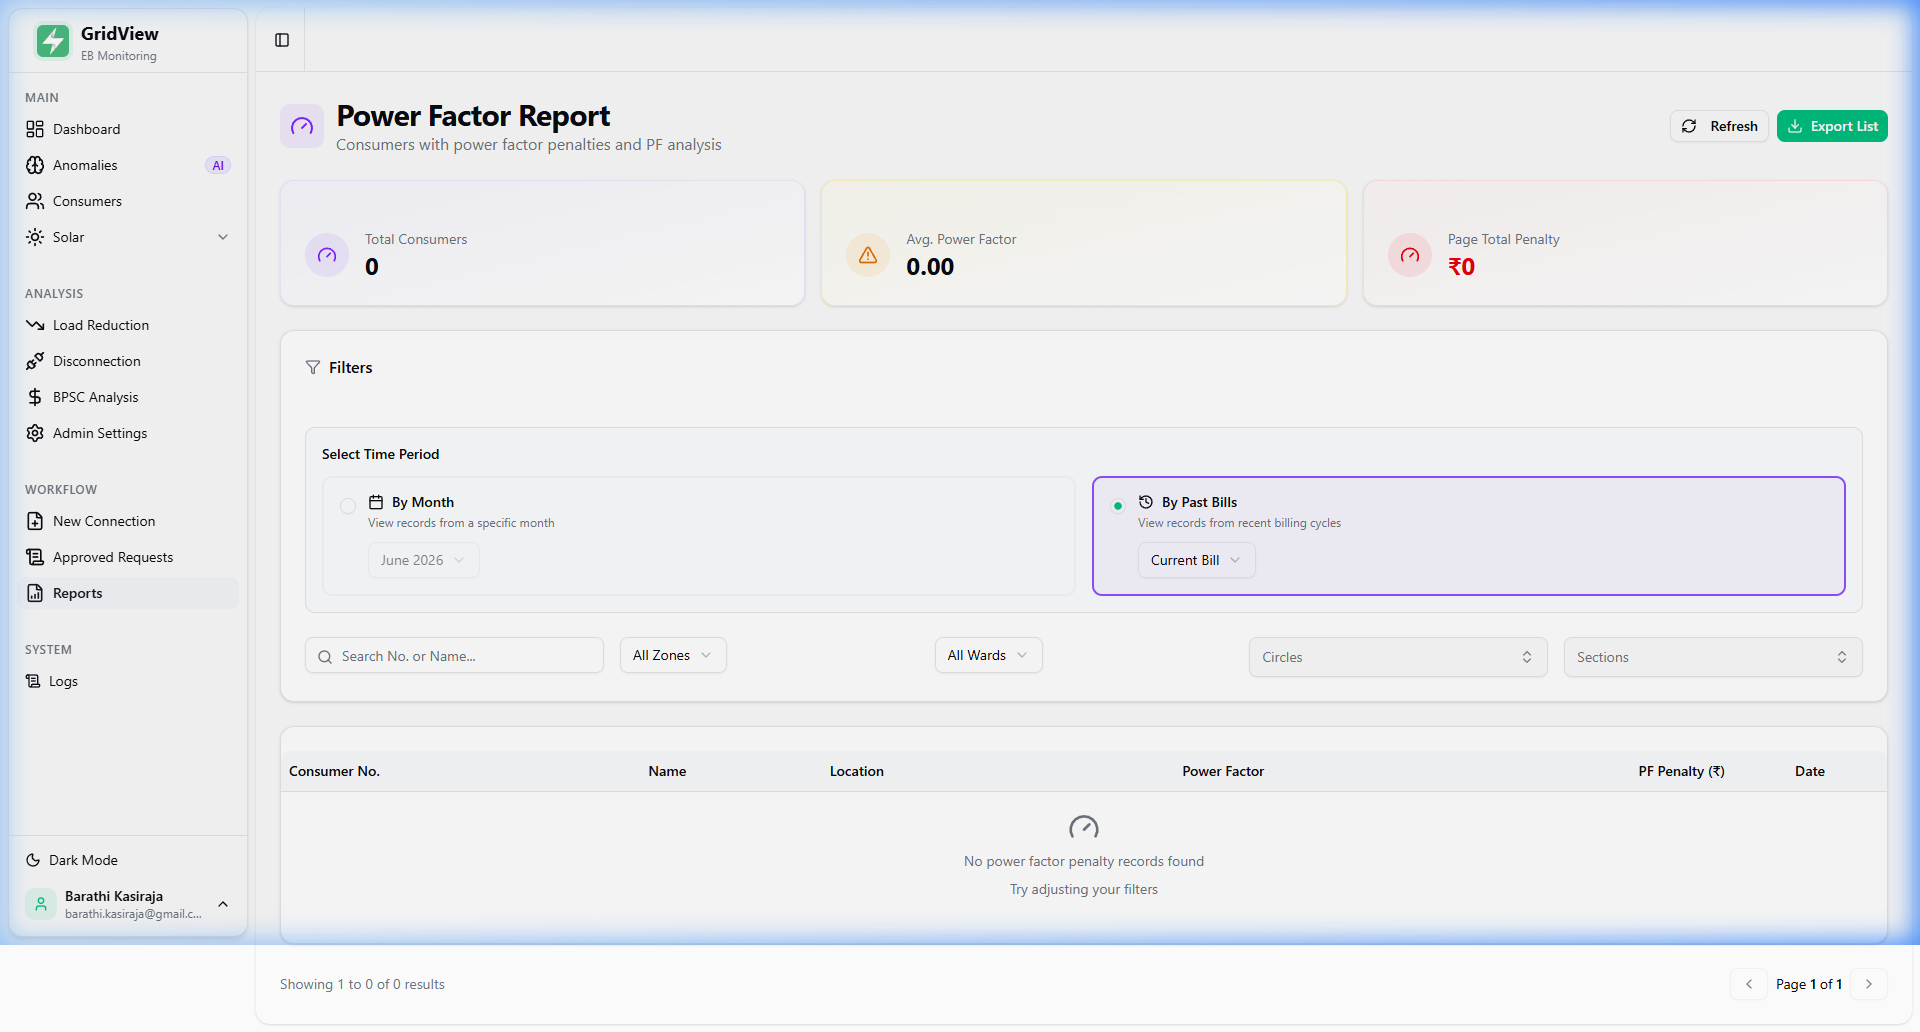
Power Factor Report
Connections where Power Factor fell below the TNEB minimum threshold, triggering a PF penalty. The report recommends installation or inspection of capacitor banks / APFC panels to bring PF back above threshold.
Consumer Report
Comprehensive consumer registry with Zone and Ward breakdown. Includes Zone/Ward/Circle/Section columns. Each row has a View button to open the individual billing profile. Exportable as Excel for official correspondence.
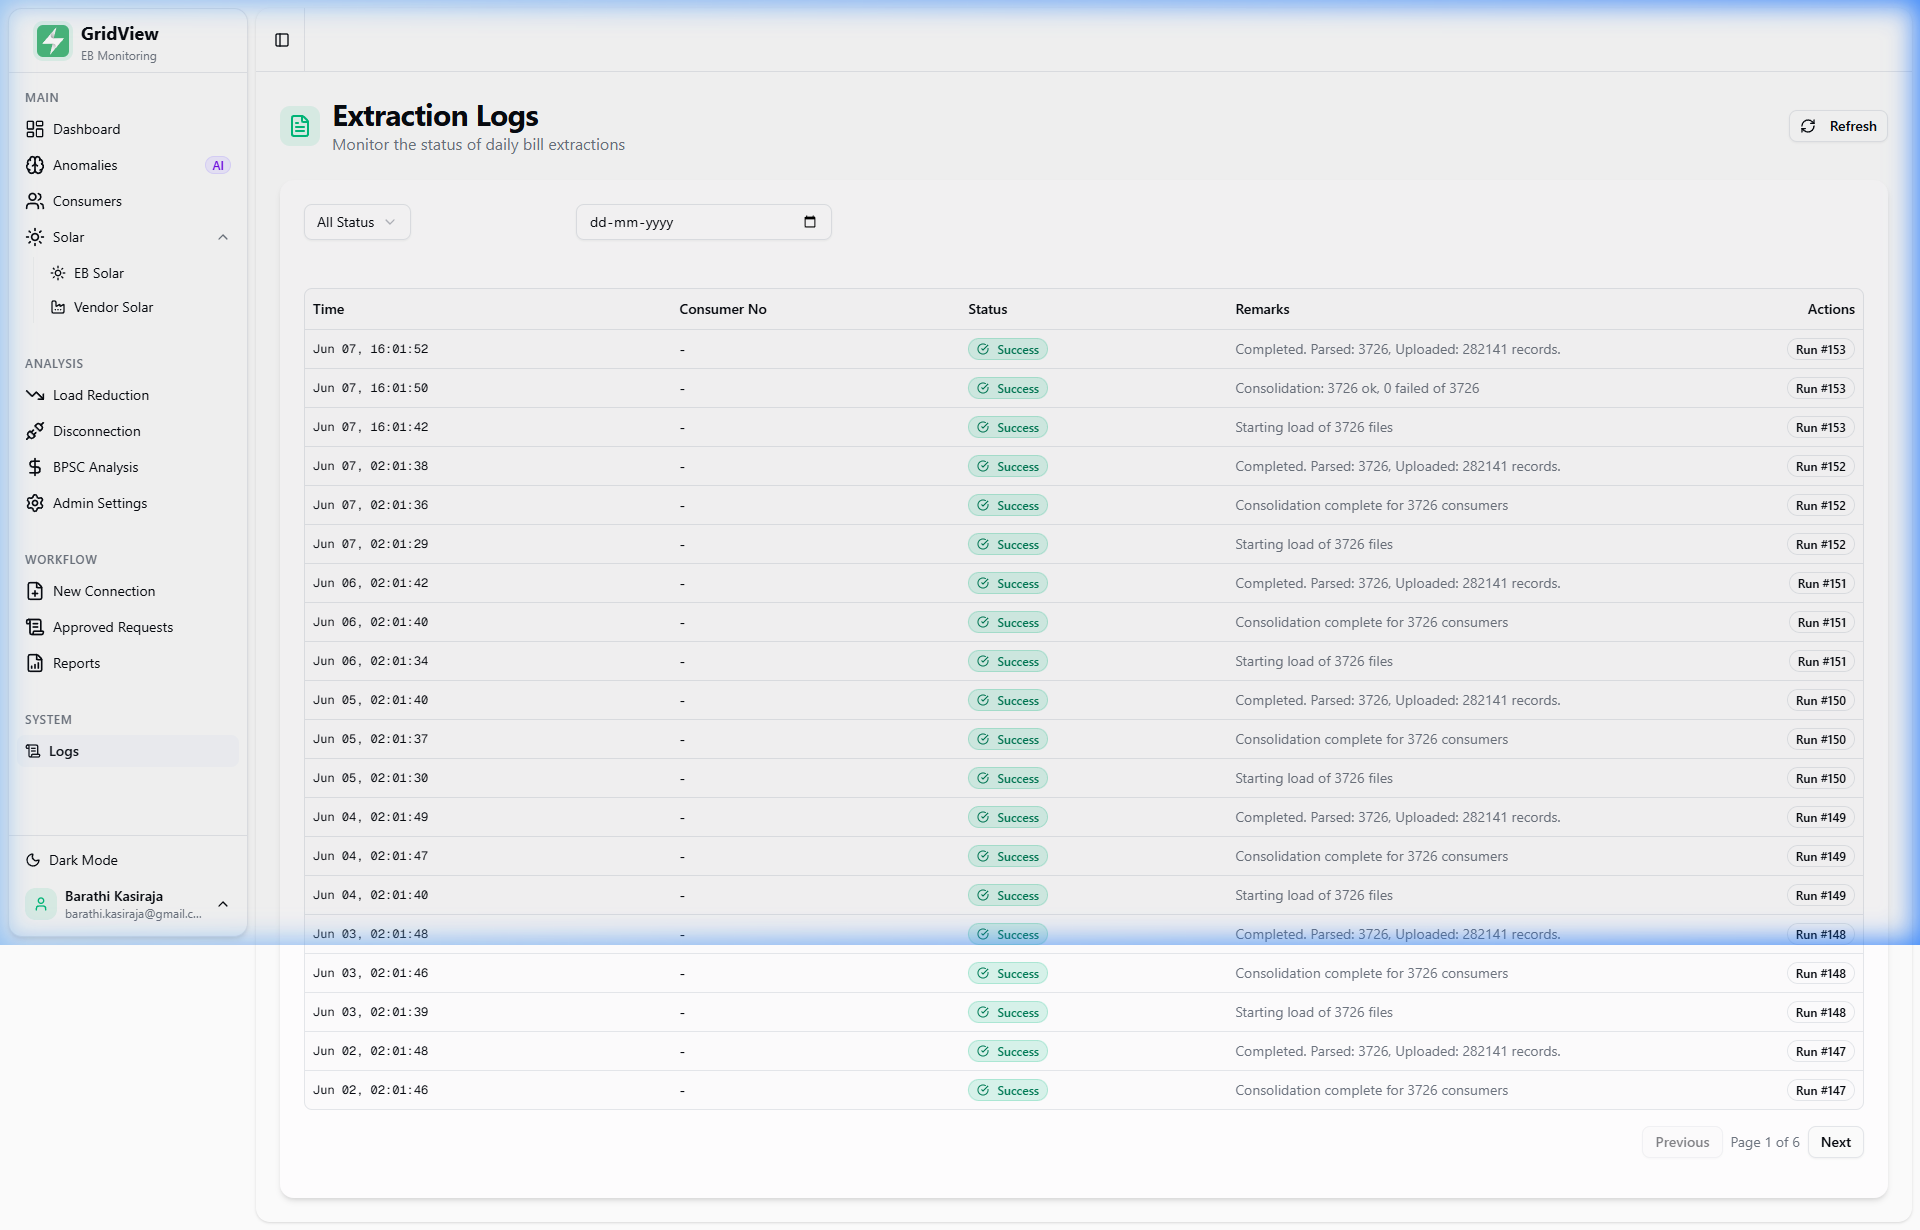
System Logs
Complete audit trail of every automated data extraction. Staff can verify that the latest bill data is loaded before acting on any report.
Daily Extraction Sequence
Each night's extraction produces exactly three log entries per run:
Day-to-Day Usage
Recommended workflow for TCMC staff to get maximum value from the platform each week.
Check System Logs (2 min)
Go to System → Logs and confirm the most recent run shows "Success" with 3,726 parsed and 2,82,141 uploaded. If it shows "Failed", escalate to the system administrator before acting on any data.
Review Critical Anomalies (5 min)
Open Anomalies. Check if there are new Critical Alerts since yesterday. For each new alert, note the consumer number and route it to the zonal engineer for physical verification. The AI analysis tells you exactly what to check on-site.
Scan Penalty Tracker (2 min)
On the Dashboard, check the Penalty Tracker. If BPSC or Excess Demand shows a spike in "Current Bill" vs. yesterday's check, drill into BPSC Analysis or Anomalies to identify which connection is responsible.
Download Pending Due Report
Go to Reports → Pending Due Report. Select the current date. Export to Excel and share with the finance / bill collection team for physical follow-up. Every day a bill is unpaid adds to BPSC exposure.
Clear Top-5 BPSC Contributors
In BPSC Analysis, identify the top 5 contributors. Prioritise payment clearance for these specific consumer accounts. Clearing just the top 2–3 accounts typically eliminates ₹5,000–₹10,000 of weekly BPSC accrual.
Process Excess Demand & PF Reports
Run Reports → Excess Demand and Power Factor. Route the output to the electrical engineering team for site-level corrective action (load verification, capacitor bank inspection).
Submit Load Reduction Applications
In Load Reduction, sort by Yearly Saving (highest first). Export the top 20–30 candidates. Submit as a bulk load reduction application to TANGEDCO. Track application status in a separate register. Each approved reduction immediately cuts the monthly bill.
Process Dormant Connection Disconnections
In Disconnection, filter for 48+ months. Physically verify a sample (10–20 connections). Submit formal disconnection requests to TNEB for confirmed dormant services. Track refund claims for ACCO/MCD deposits — up to ₹88.48 L is recoverable.
Review AI Watch List Progression
In Anomalies, open the Watch List tab. Check if any items have escalated to High Priority or Critical since last month. Close out resolved items. This is the early warning sweep to prevent small issues from becoming large penalties.
Quick Navigation Reference
| Task | Navigate To |
|---|---|
| Find overdue payers today | Reports → Pending Due Report |
| Identify load reduction candidates | Analysis → Load Reduction |
| See dormant / zero-usage connections | Analysis → Disconnection |
| Track late-payment penalty history | Analysis → BPSC Analysis |
| Get AI-flagged billing irregularities | Anomalies |
| Look up a specific consumer's bills | Consumers → Search by No. |
| Download full consumer registry | Reports → Consumer Report → Export |
| Verify data is fresh before reporting | System → Logs |
Financial Impact Summary
All figures are calculated from official TNEB bill data as of June 2026.
| Category | Nature | Year 1 Amount |
|---|---|---|
| Load Reduction (542 connections) — reduce sanctioned load to match actual usage | Recurring Savings | ₹51.66 L / year |
| Dormant Connection Disconnection (707 zero-usage services) — stop minimum fixed charges | Recurring Savings | ₹36.65 L / year |
| ACCO + MCD Deposit Refund — cash recovery on formal disconnection of dormant 707 services | One-Time Recovery (Year 1) | ₹88.48 L |
| BPSC — Belated Payment Surcharge — fully avoidable by paying bills before due date | Avoidable Penalty | ₹11.25 L / year |
| Excess Demand Penalty — incurred when metered demand exceeds sanctioned load | Avoidable Penalty | ₹3.28 L / year |
| Power Factor Penalty — charged when PF falls below TNEB threshold; fixed with capacitor banks | Avoidable Penalty | ₹4.70 L / year |
| Total Year 1 Savings Opportunity Recurring ₹1.08 Cr/yr + One-time ₹88.48 L refund |
≈ ₹1.96 Cr |